| 1
IDENTIFICATION OF THE PROBLEM |
If a child is to develop normally , certain conditions must apply
and his/her essential needs must be met.
Growth and development are ,
therefore excellent criteria for evaluating the child’s state of
health and well-being.
The child’s growth and development should be:
1. Close to the mean value , between limits (for age) within
which 95% of healthy reference children are found. When one
says a measurement is on the 50th percentile (50 pc), this
means that 50% of children of the same age in the reference
population measure more than that amount (e.g. taller or heavier)
and 50% are below (e.g. shorter or lighter).
If a measurement is on the 97 th percentile , this means that 97% of
children in the reference population fall below this level, and 3%
are above. Conversely , a measure on the 3 rd percentile will be
below the values for 97% of normal children of the same age and
above those for only 3% of normal children.
2.
Progressing at a normal rate: a curve
is normal only if it is similar (parallel) to the normal percentile
curve. If , for example , the weight curve crosses the percentile
curve downwards (see figure 1,.) , a cause must be sought (e.g.
malnutrition ,chronic disease); if , no the other hand , it rises
more rapidly than the percentile curve (see figure 1.), this may
indicate , for example , a “catch-up” growth after a period of
illness or malnutrition , or oedema from any cause , or developing
obesity.
|
3.
Without any substantial discordance
between the various aspects of development (e.g. weight,
height and sexual maturation ).The child’s psychomotor
and intellectual development can be evaluated by many
tests of which we will give only a few examples.
As for physical growth, these parameters can be compared with those from
a healthy reference population of the same age.
|
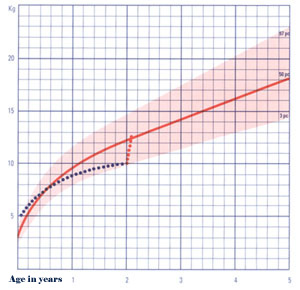 |
Fig.1-Growth curve
(weight-for-age); example of abnormal growth.
·
The standards most commonly used for
evaluating physical growth are those of the National Center
for Health Statistics (NCHS) , derived from studies of a large
number of children of different races in the United States. They are
recommended by WHD.
·
Weight (Fig.2): an easy
measurement to make with a few elementary precautions (child naked,
balance tared). The significance of weight-for-age is , itself , of
limited value , but the rate of weight gain (the growth rate) is a
very sensitive index of good health.
N.B. : when a child is weighed , check
that there is no oedema (see also malnutrition
and glomerulo-nephritis) , which affects the measurement.
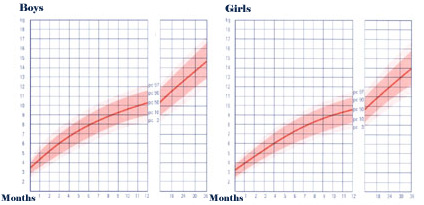
Fig.2-Weight-for-age.
·
Height (Fig. 3) : This
measurement demands more care and precision than weight , but still
represents “good health” when it is adequate. Height develops too
slowly for it to be an efficient indicator of acute malnutrition.
However , it is a good index of chronic conditions (manutrition
or disease); it is also a good index of the general state of health
of populations. Growth rate varies according to the different
periods of a child’s life. It is maximal in the first five months,
then declines and later goes through a “ spurt” at adolescence. The
growth rate slows during acute or chronic episodes of malnutrition
or disease; precise and closely spaced measurements of height allow
the demonstration of periods of slowing and acceleration.
The measurement of supine height (length) requires an accurate
measuring board and two helpers; standing height can be measured
after 24 months of age, needs only one helper and is about 10-30 mm
less than supine height.
· Weight/height
ratio: the ratio of these two measurements can help
assess “wasting” and give reasonable indication
of growth independent of age, for example when age is difficult or
impossible to determine precisely.
·
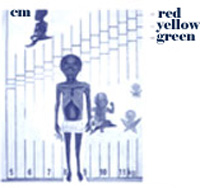
The wasting diagram (Fig.4) is
a way of expressing the weight/height ratio which allows one to
detect wasted children quickly. Each column is marked with a weight
, with three colored areas in the upper part. These show the
relation between the child’s weight-for-height and the standard
weight-for-height (NCHS standards). The child stands against the
chart in front of the column representing his weight. The color
shows the degree of wasting. “Very wasted” children are
detected by red; yellow indicates “wasted” , and green
shows normal weight-for-height(90-110% of the NCHS standard).
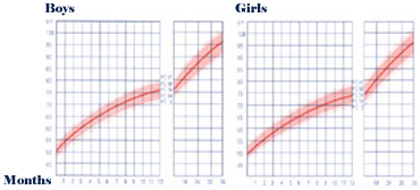
Fig. 3-Height-for-age
|
Fig.4-Weight-for-height ratio (P.J.Lamotto ,(Documents
Scientifiques Guigoz N 126, 1989) |
 |
·
Head circumference
(Fig.5) is an easy measurement to take (maximum circumference), may
reflect the development of the brain and can help with the diagnosis
or monitoring of neurological conditions.
·
Arm circumference: to be
measured on the left arm. It can be used to help assess nutritional
state and muscle mass. It is quite stable (14-16 cm) between 1 and 5
years of age (Table 1).
·
Arm circumference/head
circumference ratio:a quick and helpful index of
nutritional state which is independent of age and sex and which is
useful between the ages of 1 and 5 years:
|
Ratio = <0. 25 severe
protein-energy
malnutrition;
> 0. 25 - < 0. 32 moderate
protein-energy
malnutrition;
> =0. 32 normal.
·
growth retardation in the absence
of severe malnutrition or chronic disease requires detailed
investigation in depth, for which the child should be REFERRED.
|
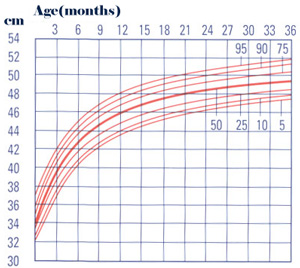 Fig. 5-Head circumference for age
(Adapted from the NCHS standards) |
Table-Arm circumference (cm)
| |
Boys |
Girls |
| |
5pc |
50pc |
95pc |
5pc |
50pc |
95pc |
| 1 to 2 years 2 to 3
years
3 to 4 years
4 to 5 years |
14.2
14.1
15.0
14.9 |
15.9 16.2
16.7
17.1 |
18.3 18.5
19.0
19.2 |
13.8 14.2
14.3
14.9 |
15.6 16.0
16.7
16.9 |
17.7 18.4
18.9
19.1 |
| 4
PSYCHOMOTOR DEVELOPMENT |
This includes motor development, i.e. development of tone and
prehension movement and stages in the development of affect and
social relationship, i.e. all that which concerns relations with
others (adults and children), and the acquisition of language. The
same stages are always followed, usually in the same order. It is
helped by close contact between mother and child and by the family
environment. The process of weaning , the birth of another child and
separation from the mother may retard this aspect of development.
The neonate shows truncal hypotonia,hypertonia of the limbs and primitive
reflexes; the child progressively acquires truncal tone, which
permits it to:
·
hold up its head at months;
·
maintain a sitting position between 6
and 8 months;
·
walk on hands and feet at about 8-9
months;
· stand upright at 9-10 months;
·
walk at about 1-2 years of age.
These different milestones are passed progressively (Fig. 6).
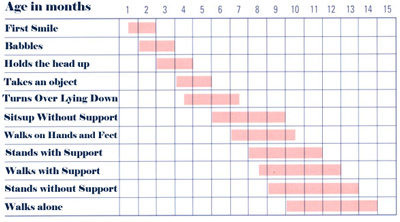
Fig. 6- Important stages in psychomotor development.
Between 9 and 12 months, the child also begins to hold objects between
thumb and forefinger, and speaks its first words. Sphincter control
begins between 15 and 18 months; at this time , the child can say
several words and combines two words to from short phrases. After 2
years of age, he becomes clean day and night; language becomes more
elaborate with complete phrases.
Certain warning signs should alert the mother and the observer:
·
a child who does not play, is not
interested in his surroundings and sleeps a great deal;
·
a child who is restless and cries
without reason, and who does not sleep at night;
·
a child who makes no or only slow
progress. When this occurs , one should take a history and make a
complete examination; if it is confirmed that there is psychomotor
retardation, REFER for diagnosis and management.
|